.avif)


How to Group Data Into Buckets Using DOMO Beast Mode
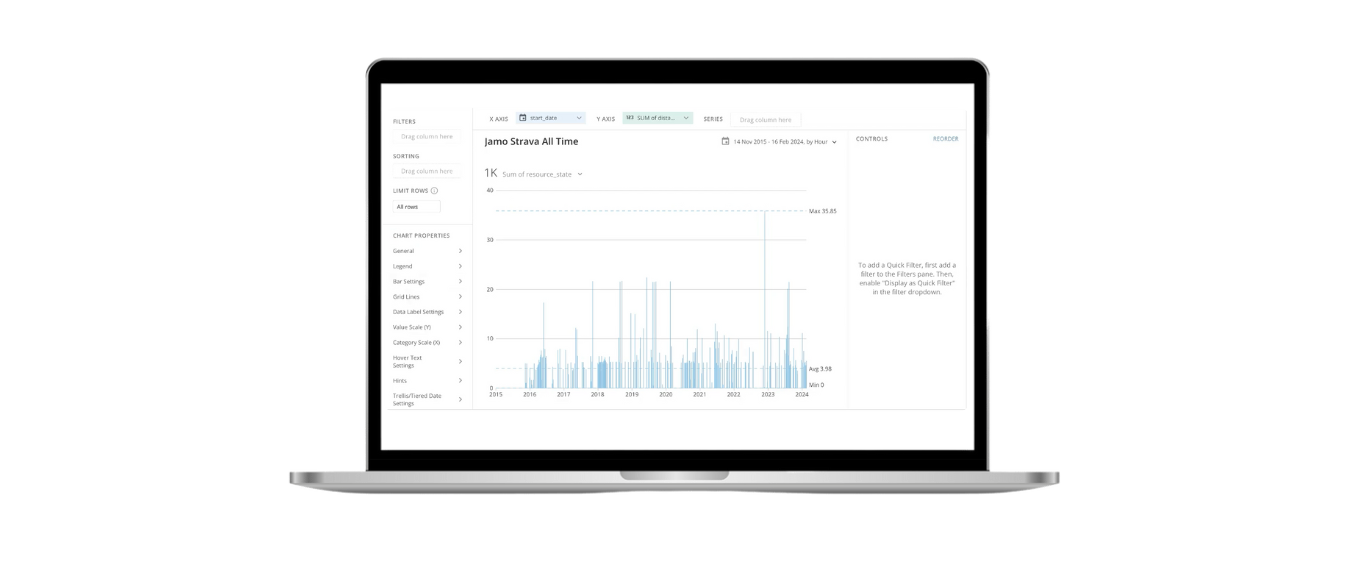
We will explain and show to you how to use Beast Mode calculations to group data into buckets. The example uses running data from a Strava account, which includes various distances run over several years. The goal is to bucket these distances to make analysis easier.
Data grouping is an essential technique in data analysis. It helps transform raw data into meaningful categories for easier analysis and visualisation. By grouping data, you can uncover patterns, trends, and insights that are otherwise hidden in the vast amounts of information.
This tutorial will explore how to use DOMO, a powerful business intelligence platform, to group data effectively. Specifically, we will dive into Beast Mode calculations—a unique feature in DOMO that allows users to create custom calculations and transformations on their data.
We'll demonstrate this process using running data from a Strava account, which includes various distances that have run over several years. Our goal is to bucket these distances into manageable segments, making it easier to analyse and visualise the data. By the end of this tutorial, you'll be able to understand how to leverage Beast Mode calculations to transform and group your data in DOMO. After this tutorial, you will have a new way to find more profound insights which will help drive better-informed business decisions.
Importing Data and Creating a Calculated Field
The first step is to import the Strava running data into the DOMO platform. This data consists of various running distances over several years. To segment this data into our ‘buckets’ we need to create a new calculated field called "Kilometres Buckets”. How to do that, we use a CASE statement. This calculated field will help categorise the data into manageable segments for better analysis.
Using a CASE Statement to Group Data
The CASE statement is a powerful feature in DOMO’s Beast Mode calculations. It is used to group the kilometres into increments of 5 kilometres. The syntax is as follows:
Example in Tutorial:

Validating and Visualising the Data
After creating the calculated field, the next step is to validate and visualise the graph. The data is then dragged into the series to show the bucketed distances. The data can be graphically displayed after validating the categorised CASE statements to facilitate insightful analysis. A bar chart can illustrate the frequency of runs within each distance category, providing a visually striking representation of the distribution of running distances over the years.
Example in Tutorial:
Filtering Data for Deeper Analysis
In addition to bucketing data, filtering can be used to focus on specific distance ranges. For example, filtering the data to show only distances between 0 and 30 kilometres and changing the graph to show data per month provides a more detailed analysis, which allows for shorter runs. Changing the chart to show data each month can further enhance the analysis, revealing the seasonal and monthly trends in running distances.
Using Beast Mode calculations to group data into buckets is a prominent technique for data analysis. This technique can be implemented quickly and easily, making it a valuable tool for data visualisation and analysis with DOMO. If you didn’t know, now YOU KNOW.
Have you enjoyed the read? Then book a demo with DOMO.

.png)
.jpg)